Handling Uncertainty in Project Planning
Introduction
The majority of project planning effort today is still performed in a strictly “deterministic” manner. All project tasks and resources are assigned and executed within well defined timeframes. At the same time we all know that real life necessitates corrective actions:
|
It’s easy to mentally grasp such uncertainties and have an accurate estimate when dealing with a few variables. With large scale projects however having multiple uncertainty factors of a different nature and character means such analysis can not be performed manually. It demands a very special effort for an accurate project assessment.
Project Planning Tools
Such uncertainty in project planning is widely recognized in a lot of industries and a wide variety of different tools exists to help optimize the planning process and minimize the associated risks. These tools cover a wide range of offerings from the mathematically rigorous and sophisticated solvers (mainly constraint based programming) to different Excel adds on (VBA macro based) doing similar things but on a simpler level. You could even find a freebie to do some optimisation of your Excel based projects or dependencies.
Approach to Project Planning
In this paper we share the approach we recommend you implement when dealing with the planning, assessment and optimisation of large and cumbersome projects. We focus on software development projects however this approach is valid for a wide selection of projects in all industries.
The following situation is very common for a product development organization. How to rapidly develop an accurate project plan estimate which is critical to the overall development lifecycle (resources, relation to other projects and dependencies on other deliverables should be always well defined) and at the same time minimize the time spent performing “if-then-else” analysis. Business and technical analysts and project managers have their hands full doing “real things” – implementing new customer requested functions and working on the next release of the product.
By setting up a few extra steps in your planning processes, and applying a specialized tool against our project plan, we believe that you will have the right solution and be able to define the correct approach to this problem.
Project Planning Process
The process of planning and assessment consists of the 5 main steps:
Define the Project
During this phase we put together the regular project plan in MS Project with the main tasks, timeframes and deliverables. The project plan can be created either manually, or be generated as the result of other efforts (doing some preliminary use cases or object design or working with the cost estimate tools).
Identify Uncertainly
In this phase we need to determine:
-
- Which tasks, or their inputs in the plan are uncertain
- What we know about these uncertainties
- What would be the best way to describe these uncertainties
- The behaviour and known range of values they might cover.
During this phase we also need to identify what are the most critical results we want to look at, analyse and optimize as outputs of our plan.
Apply the tool and implement the model
From the wide variety of the available packages we’ve selected Palisade’s “@Risk” for Project (http://www.palisade.com) as our project optimisation tool. We believe that this tool is a good match for most requirements.
It is:
- Integrated with the MS project
- Easy to set up the model
- Sufficient depth of simulation and outputs
- Is easy to use for analysis
A particular tool selection only affects the way an uncertainty model will be applied. The general approach to problem handling will remain the same.
Run simulation
As the result of the Monte Carlo simulation (parameters of this simulation can be configured as well) we can obtain the ranges and probabilities of all outcomes for the outputs that we’ve identified during model setup. Normally it’s the ranges of the duration for particular phases, or the project with the most critical dependencies, overall project timeframe, etc.
Make a decision
Based on the simulation results, and looking at the outputs of the model, we obtain the information about most critical characteristics of the project. This data serve as the basis for the following optimisation and corrective actions.
Working with the tool
“@Risk” is tightly integrated with MS Project and looks as the additional tool set on the MS project panel (see picture below). By selecting particular project parameters (for example duration of the task) and clicking on the “Define Distribution” icon on the “@Risk” tool bar, we can set up model characteristics.
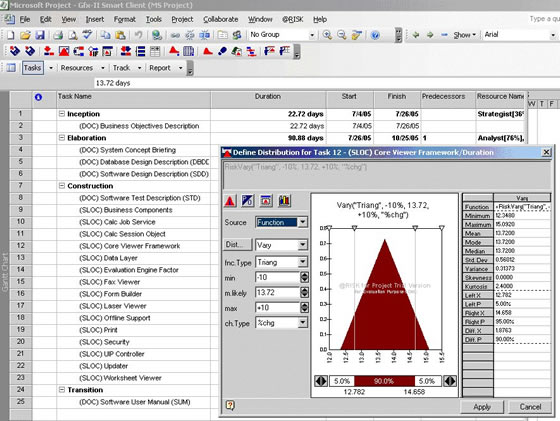
Figure 1. Model Setup
The tool is quite flexible in definition of the distribution widows. Out of the box it’s easy to find anything from the uniform or normal distribution, up to the more exotic ones, see picture below.
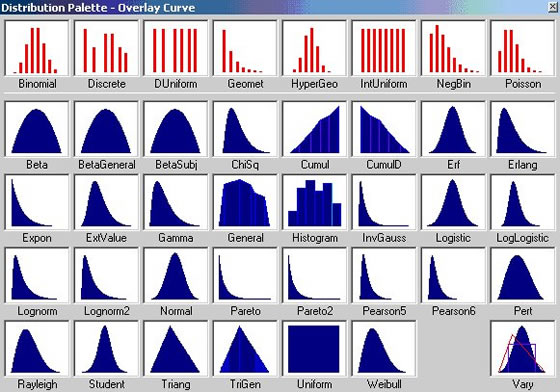
Figure 2. Different available distribution functions
Establishing Project Parameters
We use our past projects experience and “historical” knowledge to define the possible ranges for different tasks and distribution functions. For any distribution function we can define its “fine structure”, like average value, standard deviation, etc. There is also another advanced feature which allows us to add additional “custom” uncertainties to the selected tasks or group of tasks.
Model outputs are specified in the same manner. Click on the selected cell (for example, finish date or duration) and specify it as the output. You can see the corresponding notations in the @Risk:Functions column of the Project, see picture below.
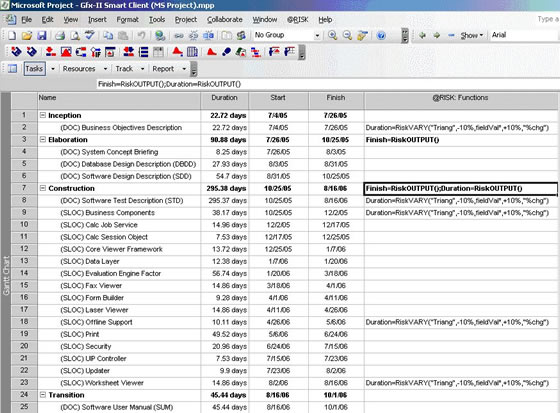
Figure 3. Specifying model outputs
Creating the Implementation Model
An implemented model could be enhanced by putting additional conditions (see on the previous picture (e.g. a “@Risk” icon with an “IF” on it, 6 th from the left on the tool bar). For example, we know that if we’d spent all available time on doing one particular task another dependent task should happen only within strictly limited timeframe and that’s exactly what “If-Then” function of the model is supposed to take into account.
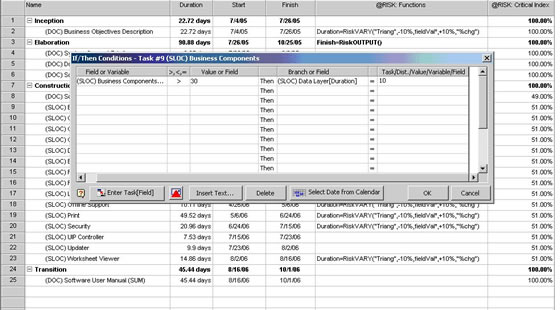
Figure 4. Model enhancement with “If/Then” conditions
Project Model Output
After running the simulation, the output window will look like the one presented below.
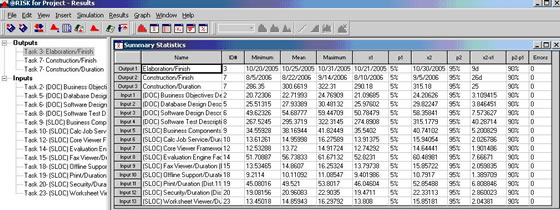
Figure 5. Simulation results
You can see the defined outputs of the finish dates for the elaboration and construction phases, as well as the total duration of the construction phase (as they were defined as the outputs of the model). Results show quite a significant range in the finish date for the construction phase (overall more than a month uncertainty in the final date) and we might want to re-evaluate the project setup (sequence and task dependencies as well as resource allocation).
The simulation data provide answers to the additional questions. For example to give the probability that the project or its phase will be finished before the certain date together with providing more granular information about project dynamics and showing the most critical parameters for the project cycle (sensitivity analysis)

Figure 6. Scenario and Sensitivity Analysis
There are multiple ways to display the graphical representation of the simulation results. This also makes the analysis tasks easier, see picture below.

Figure 7. Graphical representation of results
Pertmaster
For due diligence we did set up of the same model in “Pertmaster”, see below:

Figure 8. Model setup in PERTMASTER
The simulation shows very similar results. Graphical output from this tool is slightly different and just for the sake of illustration we’ve selected different model output and criteria to show. On the picture below you can see the projected finish date of the project and associated probability of this event.
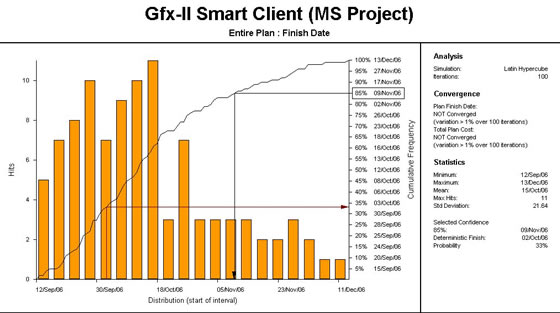
Figure 9. Results graphical representation in Pertmaster
Conclusion
In this paper we have described the approach to handle uncertainties in project planning. This approach includes development and implementation of the risk model which describes these uncertainties followed by running a simulation to generate predefined project outcomes or the most critical parameters. We also touched briefly on several available tools and provided some examples on how they function (mostly “@Risk” from Palisade and “Pertmaster”).
About the Author
Dmitri Ilkaev has almost twenty years of experience in software and technology development. He holds Ph.D. in Computer Sciences from Moscow Institute of Physics and Technology. Dmitri is the Chief Technologist at Tier Technologies (http://www.tier.com) in Scottsdale, AZ. He can be reached at DILkaev@tier.com
Copyright Project Perfect
