7 “S” of Defects Occurrence – A Case Study
Abstract
Recent software development models show how the testing activities relate to the development activities. There are defects in the software products developed by software vendors, even though there is an involvement in testing at an early stage in the software development life cycle. If we conduct a defect prevention or defect monitoring meeting then the 7 “S” activities will occur on a rotation basis. This paper describes the 7 “S” of defect occurrence. Results of a case study are analysed before and after implementation of 7 “S” for an improvement in defect detection.
Introduction:
The Software Development Life Cycle (SDLC) [1] always has deficiencies with regard to test activities. Real testing [2] activity starts after the coding stage at which point the implementation appears to be complete. Each SDLC stage injects defects [3] into the application. The percentage of defects injected may vary from one stage to another.
It is well known that correcting defects in later stages of the SDLC is more complicated, expensive and time-consuming than correcting them in earlier stages. Preferable, even to early detection, is the avoidance of defects altogether – the Defect Prevention (DP) method. DP is therefore the best way to optimizer the development process costs and to shorten the development cycle time [4] .
DP [5] activity is a mechanism for spreading lessons learned across the projects. The Goal of DP is to define and implement techniques to reduce the total number of defects in the SDLC and to prevent certain classes of defects from recurring [6] .
The defects may have been identified on other projects as well as in earlier stages or tasks of the current project. If we have DP [7, 8] activity at every stage then there is a tendency to reduce the number of defects. DP involves analysing defects that were encountered in the past and taking specific actions to prevent the occurrence of those types of defects in the future.
Defect classification [3] will help to identify the causes of defect occurrence. These causes will encourage the use of DP activity in the SDLC. Implementation of DP activity and its results are analysed by a case study.
The objective of the case study is to define and implement DP methods and techniques, for the various stages of the SDLC, to reduce the quantity of defects and then to determine a strategy for decreasing the testing effort needed for development projects in an organization.
Any organization should follow a series of steps [9] to perform DP activities. Each step requires dealing with defects. These defects occurrence and prevention will be discussed in each steps of DP activity.
Defects occurrence reduces by implementing a DP process in any organization. It has been observed that average 40-50% [6, 10] of defects are covered in every stage of the SDLC by DP activities.
If the detection of these 40% of defects is covered by DP activities then it reduces the cost of developing the software drastically. The rest (60%) of defects are mostly identified in the testing stage. But there is some defects seepage in the production. The case study discusses how to measure the defect coverage by DP activity. It also describes how those defects occur in the different stages and then into the production stage. This paper then describes the major reasons for defects seepage from one stage to another stage.
Case Study:
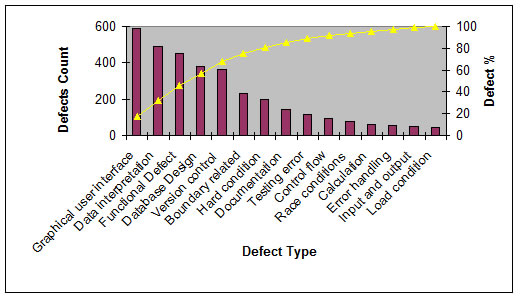
This case study has been performed for five applications developed in JAVA technology. Total source code is of 300 KLOC (Kilo lines of code). Rigorous testing has been carried out to detect all the possible defects. There are 3338 defects in all the stages of SDLC. The defect occurrence rate is 11.13 Defects/KLOC. Defects are collected and analysed as per defect types [3] in figure 1.

Figure 1: Defect analysis
From figure 1, we can infer that major percentage of defects are functional and design defects. These defects are categorized with respect to defect origin and defect detection activity in table 1 and figure 2.
Table 1: Defect detection in different Origin
|
Defect Origin |
||||||||||||
|
RS |
HLD |
LLD |
Code |
UT |
MT |
ST |
PD |
Total |
ACC |
ACC% |
||
|
Defect Detection Activity |
RR |
5 |
|
|
|
|
|
|
|
5 |
5 |
0.15 |
| HI |
71 |
649 |
|
|
|
|
|
|
720 |
725 |
21.72 |
|
| LI |
4 |
57 |
649 |
|
|
|
|
|
710 |
1435 |
42.99 |
|
| CI |
16 |
19 |
89 |
865 |
|
|
|
|
989 |
2424 |
72.62 |
|
| UT |
14 |
31 |
31 |
215 |
30 |
|
|
|
321 |
2745 |
82.23 |
|
| MT |
12 |
39 |
45 |
234 |
|
41 |
|
|
371 |
3116 |
93.35 |
|
| ST |
7 |
9 |
27 |
82 |
|
|
26 |
|
151 |
3267 |
97.87 |
|
| PD |
4 |
14 |
14 |
28 |
|
|
|
11 |
71 |
3338 |
100.00 |
|
| Total |
133 |
818 |
855 |
1424 |
30 |
41 |
26 |
11 |
3338 |
|||
The nomenclatures are used in this case study are as follows:
|
|

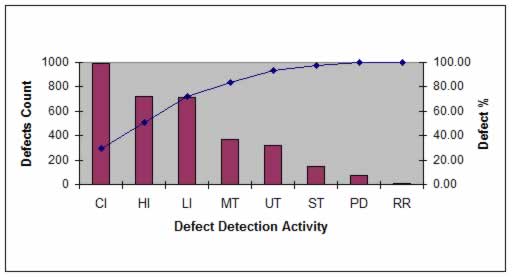
Figure 2: Defect analysis Vs Defect detection activity
From figure 2, we can conclude that majority of the defects are detected by code and design inspection. From figure 1 & 2, it is observed that majority of the defects can be reduced by DP activity. While developing the application, conventional DP [11] methods will be implemented to reduce these defect occurrences in the three inspection phases. In addition to these, there are so many deficiencies in software quality processes, which are the basic root causes of defect occurrence. This paper describes these causes of defect occurrence in the form of 7″S”.
7 “S” of Defects Occurrence:
1 S : ( Specification understanding)
If business software is developed without sufficient understanding of the requirement specifications, then this deficiency of the requirements costs more to operate and maintain the system in production. It is soon observed after installation that the software is not powerful, fast, portable, compatible and reliable enough to use. From the beginning, the quality team or development team should trace the requirement through horizontal or vertical traceability matrix. It is easy to trace the customer’s stated requirements. It may not be possible however to trace the customer’s implied requirements through traceability matrix. A traceability matrix is not the only solution to overcome this problem.
2 S : ( Short fall in Design)
The design should be perfect for software development. It is observed that many projects fail due to poor design. It may be architectural design, conceptual design, database design etc. Much software has been developed, installed and passed to maintenance with a faulty design. Developer finds that design is not up to the mark in the new maintenance phase. The faulty design should be corrected, implemented in the new release to attain less defects and high customer satisfaction. After several months, the team/designer changes and the cycle repeat. It is recommended not to have single design defect in the production. Design standard and review check list help to deliver a fault free design.
3 S : ( Schedule variation)
Software is developed to automate a set of business processes but the requirements change so frequently that the project gets far behind the schedule and the output of the system becomes unreliable. Periodically, the developer is pulled off the project in order to incorporate all the requirements, which makes them fall even further behind the schedule. Due to this busy schedule, there may be many defects in the application. It may not possible to capture all the defects to meet the schedule of delivery.
It is better to freeze the requirements before entering into the main phase of product development. The schedule should not be focused on making the customer happy. The customer should be given a reasonable schedule. Customer will be delighted if the organization delivers a defect free application with reasonable schedules and a project plan.
4 S : ( Slippage of Process)
It is observed that many applications reach the final stages without unit testing; review of the test cases, design documents, code, etc. Due to the lack of these processes, the application is released with uncovered defects, which could have been rectified at an early stage if proper processes were in place. If such an application is given to the customer, it will be returned for proper re certification and revalidation. This proves to be costly for the customer as well as the organization. Such an unhappy customer will not return due to the lack in proper process.
5 S : ( Shortage of Domain Experts)
Several business applications are developed without inclusion of domain experts. This happens due to shortage of resources or if the organization is reluctant to recruit a resource for the specific job. Especially with Engineering software, Logistic, Supply chain management, Medical, Finance, Enterprise Planning software you need to have domain experts to understand the requirements. Domain experts understand the right progress of the development process. These domain experts can do better functional testing than the conventional testing team.
6 S : ( Shortening the Testing time)
Almost every time there are factors which cause the development process to be delayed. Often the client is adamant that the software is delivered to schedule. The project team shortens the testing time because it is the last phase in the SDLC. The testing team delivers the software after ad hoc testing instead of a complete testing process. Ultimately organization gets a bad name for the production defects, which could have been resolved at an early stage. It is not unknown that some project get only a few hours for testing before delivery.
7 S : ( Should oppose)
The testing team should not be biased towards the development team. The software product is the baby of the development team. The development team doesn’t want any criticism of their application. The testing team should always move in the opposite direction to achieve the ultimate quality. It often happens that whatever the development team says, the testing team accept. From the testing team’s perspective, the reverse is always good for the organization. Testing team identifies errors, and therefore appears to place the blame of those errors on the development team. This approach can lead to “us versus them” attitude among the entire team. It’s modeled after the better-known four Phases of Grief [12], and is called the four Phases of Software Testing.
The four Phases of Software Testing are:
- Arrogance – “You are just here to validate that my software is 100% perfect.”
- Denial – “You are not testing properly – there is nothing wrong with that feature. Try it again.”
- Pleading – “Oh really! Can you help me to fix it?”
- Acceptance – “OK, now we know how to avoid that situation next time. What are we testing next?”
Summary
These are the 7 “S” gathered from my own experience. These are the common complaints by which most software projects fail. Verification and validation will help to overcome the above cases. The software fails more often, because most organizations don’t apply the same care and professionalism to the DP activities as they do for the software development.
Result after implementation of 7S:
The 7 “S” activities are implemented along with conventional DP activities [8, 11]. The results have been analysed for five applications developed in JAVA technology. Total source code is of 300 KLOC. The analysis results are discussed below in table 2 and figure 3.
Table 2: Defect Detection in different Origin after 7S implementation
|
|
|
Defect Origin |
|
|
||||||||
|
|
|
RS |
HLD |
LLD |
Code |
UT |
MT |
ST |
PD |
Total |
ACC |
ACC% |
|
Defect Detection Activity |
RR |
2 |
|
|
|
|
|
|
|
2 |
2 |
0.11 |
| HI |
41 |
356 |
|
|
|
|
|
|
397 |
399 |
20.97 |
|
| LI |
2 |
31 |
356 |
|
|
|
|
|
389 |
788 |
41.41 |
|
| CI |
9 |
11 |
41 |
569 |
|
|
|
|
630 |
1418 |
74.51 |
|
| UT |
8 |
14 |
14 |
106 |
21 |
|
|
|
163 |
1581 |
83.08 |
|
| MT |
7 |
22 |
21 |
111 |
|
32 |
|
|
193 |
1774 |
93.22 |
|
| ST |
4 |
6 |
12 |
45 |
|
|
22 |
|
89 |
1863 |
97.90 |
|
| PD |
2 |
8 |
9 |
12 |
|
|
|
9 |
40 |
1903 |
100.00 |
|
| Total |
75 |
448 |
453 |
843 |
21 |
32 |
22 |
9 |
1903 |
|||

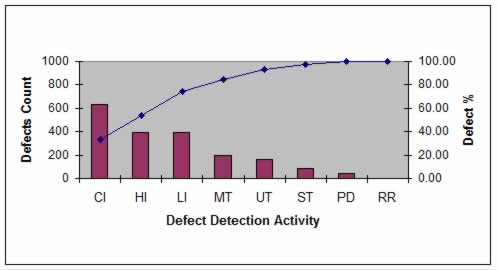
Figure 3: Defect analysis after 7S implementation

Figure 4: Comparison graph of 7S implementation
From the table 2 and figure 3 & 4 we can draw the following inferences:
- Defect occurrence rate has reduced to 6.34 Defects/KLOC. There is a 42% improvement in defect occurrence rate.
- The majority of the defects are detected by code and design inspection even after 7″S” implementation (Figure 3). But defect occurrence has been reduced drastically in all the stages of SDLC.
- The improvement of defect occurrence in different stage varies from 30-50%. The average improvement is about 35.2%.
- A comparison graph has been depicted in figure 4, which shows an improvement in results for 7″S” implementation.
Conclusion and Future work:
If any organization performs DP activities in every stages of SDLC then this 7 “S” will be reflecting in all the projects. It is better to initiate these 7 “S” activities in the initial phases of the projects. This will save lots of revenue and time for any organization. Many software service industries execute projects with the deficiency of more than one “S” and it causes defect seepage to production. The advantages of these 7 “S” are that these are the existing activities in SDLC process. There is no additional investment to implement these “S”.
We have identified this as the macro level of 7 “S” for defects occurrence. If we drill down to some more depth then we can find micro level causes of defects occurrence for each “S”. Future work will be to identify these micro level activities.
Copyright Project Perfect
